Pick a Card Any Card - 300 points
Objective
In this experiment you will test if the probability of drawing a particular card from a deck depends upon the number of that type of card in the deck.
Introduction
Read through the introduction portion of your packet.
Terms, Concepts and Questions to Start Background Research
To do this type of experiment you should know what the following terms mean. Have an adult help you search the Internet, or take you to your local library to find out more!
Define:
probability
chance
strategy
likelihood
Materials and Equipment
Now that you are familiar with the terminology we will be using, you must gather the materials listed below.
· a deck of playing cards (from your advisor)
· notebook
· pencil
· calculator (from your advisor)
Experimental Procedure
Now follow the directions to complete the experiment:
1. Prepare the deck of cards for your experiment. Count the cards to make sure the deck is complete (each deck should have 52 cards total). Remember to take out the jokers! Shuffle the deck three times and set aside. 2. Prepare a data table for your data. The table should include space to write all of your observations, including the name of the type of card, the number of the type of card in the deck, the number of cards drawn for each trial and space to add together and average your data. Use the sample table found in your packet 3. Choose your first type of card and write it in the first column of your data table. Count how many of that type of card there are in the deck and write this number in your table. 4. Draw cards from the top of the deck and flip them over one at a time, counting as you go. When you get to the type of card you are looking for, stop and write down the number of cards you have drawn in your table. This will be your first trial. 5. Shuffle the cards and repeat step 4 nine more times to get a total of ten trials for the first type of card. 6. Repeat steps 3–5 for each type of card you would like to test (that is, for each column in your data table). 7. Now you will want to tally up your data by adding together the number of cards drawn for the ten trials in each column. Write your answer in the "TOTALS" row. Are the numbers similar or different? 8. Next, you will want to calculate an average for each experiment. The average is a way to combine the results of all of your trials into one number, which will be useful for graphing and understanding the results of your experiment. Do this by dividing the number in each "TOTALS" box by ten, and writing the answer below in the "AVERAGES" box of the data table. 9. Now you can analyze your data by making a few graphs: o You can use a bar graph to show the average number of cards that were drawn for each specific type of card you wanted. On the left side of the graph (Y-axis) you will put a scale for the average number of cards drawn, and on the bottom of the graph (X-axis) you will put your bars and labels. Use one bar for each type of card and draw the bar up to the corresponding number on the left (Y-axis) of the graph. Which cards were the most difficult to draw? The easiest to draw? Were there any similarities or differences between different types of cards and the likelihood that you could draw them? o You can also make a line graph showing how the number of cards drawn compares to the number of that type of card in the deck. On the left side of the graph (Y-axis) you will put a scale for the average number of cards drawn, and on the bottom of the graph (X-axis) you will put a scale representing the number of each type of card in the deck. Did you need to draw more or less cards to choose cards that were rare compared to cards that were common? 10. Interpret your results. Did the number of each type of card present in the deck change the number of cards it took to pick the card you wanted? Which cards were most likely to be drawn? The least likely? Did the probability of choosing a specific type of card change depending upon it's representation in the deck? Make a conclusion. Graph Your Results · A more advanced way of showing the results of your experiment is to make histograms, which are a type of graph that shows distributions. They are especially useful for visualizing probabilities. Try making a separate histogram for each type of card you tested. Do this by graphing the number of cards drawn for each trial separately in a bar graph. When all of the bars are lined up next to each other, what does the overall shape of the distribution look like? · The probability of drawing a particular type of card also depends upon the number of cards drawn each time. Try another experiment to see how your chances of drawing a particular card change as you draw more cards each time. Try drawing samples of 3 cards, 5 cards, or 7 cards. Do your chances improve as more cards are taken? · Probabilities also change as cards are removed from or added to the deck. Try the experiment again, but this time remove cards from the deck before your experiment. Try using two decks of cards combined together. Does your data change? Why or why not? Try removing select cards from the deck, like taking out half of the red or black cards, before doing the experiment. Will this change your chances? What if you left the Jokers in the deck? How would this change your results? · Probabilities can change your strategies for playing a card game. Can you do an experiment to show how probabilities can help you choose cards when playing Go-Fish? What about other popular cards games like War, Memory, or Solitaire? Can you develop rules for a winning strategy? Can you invent your own card game based on probabilities?
Rollin’ the Dice of Probability - 400 points
Objective
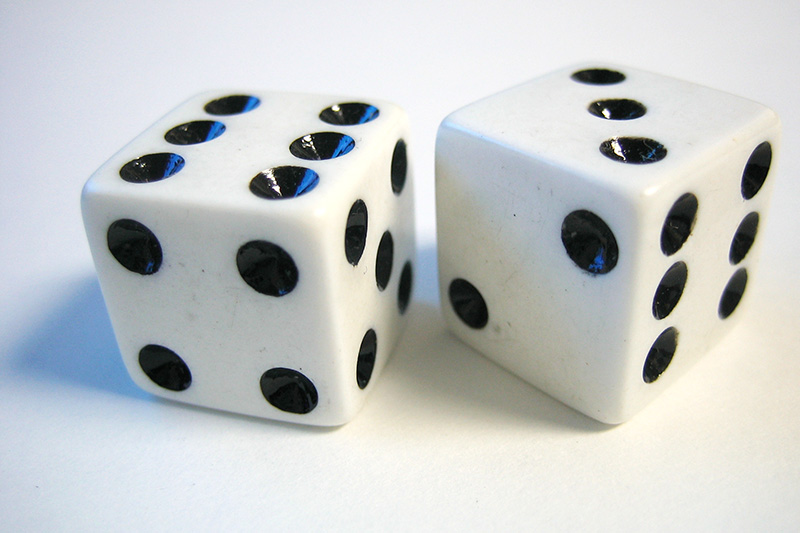
The purpose of this project is to test the probabilities of rolling certain combinations of dice in roll-playing games. Are you more likely to roll a sum of at least 18 with 3 ten-sided dice or 5 six-sided dice?
Introduction Read through the introduction portion of your packet. Terms, Concepts and Questions to Start Background Research In order to properly do this experiment, you will need to understand the basics of probability theory. There are many sites on the internet that explain basic probability theory. This site takes you step by step through the basics that you will need to understand in order to estimate the likelihood of getting a certain outcome on the dice: http://library.thinkquest.org/11506/learn.html This site specifically talks about applying probability theory to rolling dice: http://mathforum.org/library/drmath/view/56498.html Materials and Equipment Now that you are familiar with the terminology we will be using, you must gather the materials listed below. · 3 ten-sided dice · 5 six-sided dice Experimental Procedures:
Roll each combination of dice 100 times.
Record the results of each roll in an excel spreadsheet.
Determine the probability of getting a sum higher than 18 for each combination of dice when rolling each combination 100 times.
Which combination has a higher probability and was this true when you rolled them?
In what ways to you feel you can use what you have learned about probability to help you in real life?
Create a Game of Chances - 300 points
Each student must take what they have learned about probability and gaming and use it to create a game that tests the laws of probability. The game must be: • Unique – a concept that has never been done before (50 points) • Appealing – to high school students (25 points) • Challenging - makes people think and correctly utilizes the laws of probabilty (50 points)
• Creative – has a theme that resonates with players and is consistent throughout (25 points)
• Rules – has a clearly defined set of rules that are written up and easy for players to understand. (50 points)
• Essay - include a three paragraph essay that connects the game concept to the laws of probability (100 points)